
In February 2011, the University of Kentucky's institutional research office published a short brief built on a question most campuses never ask. It split the first-year class by where students lived and compared who came back for a second year.
Among students who started in fall 2008, 81.9% of those in residence halls returned. For first-years living off campus, the figure was 70.9%. The next class showed the same pattern, at 82.8% and 75.9%.
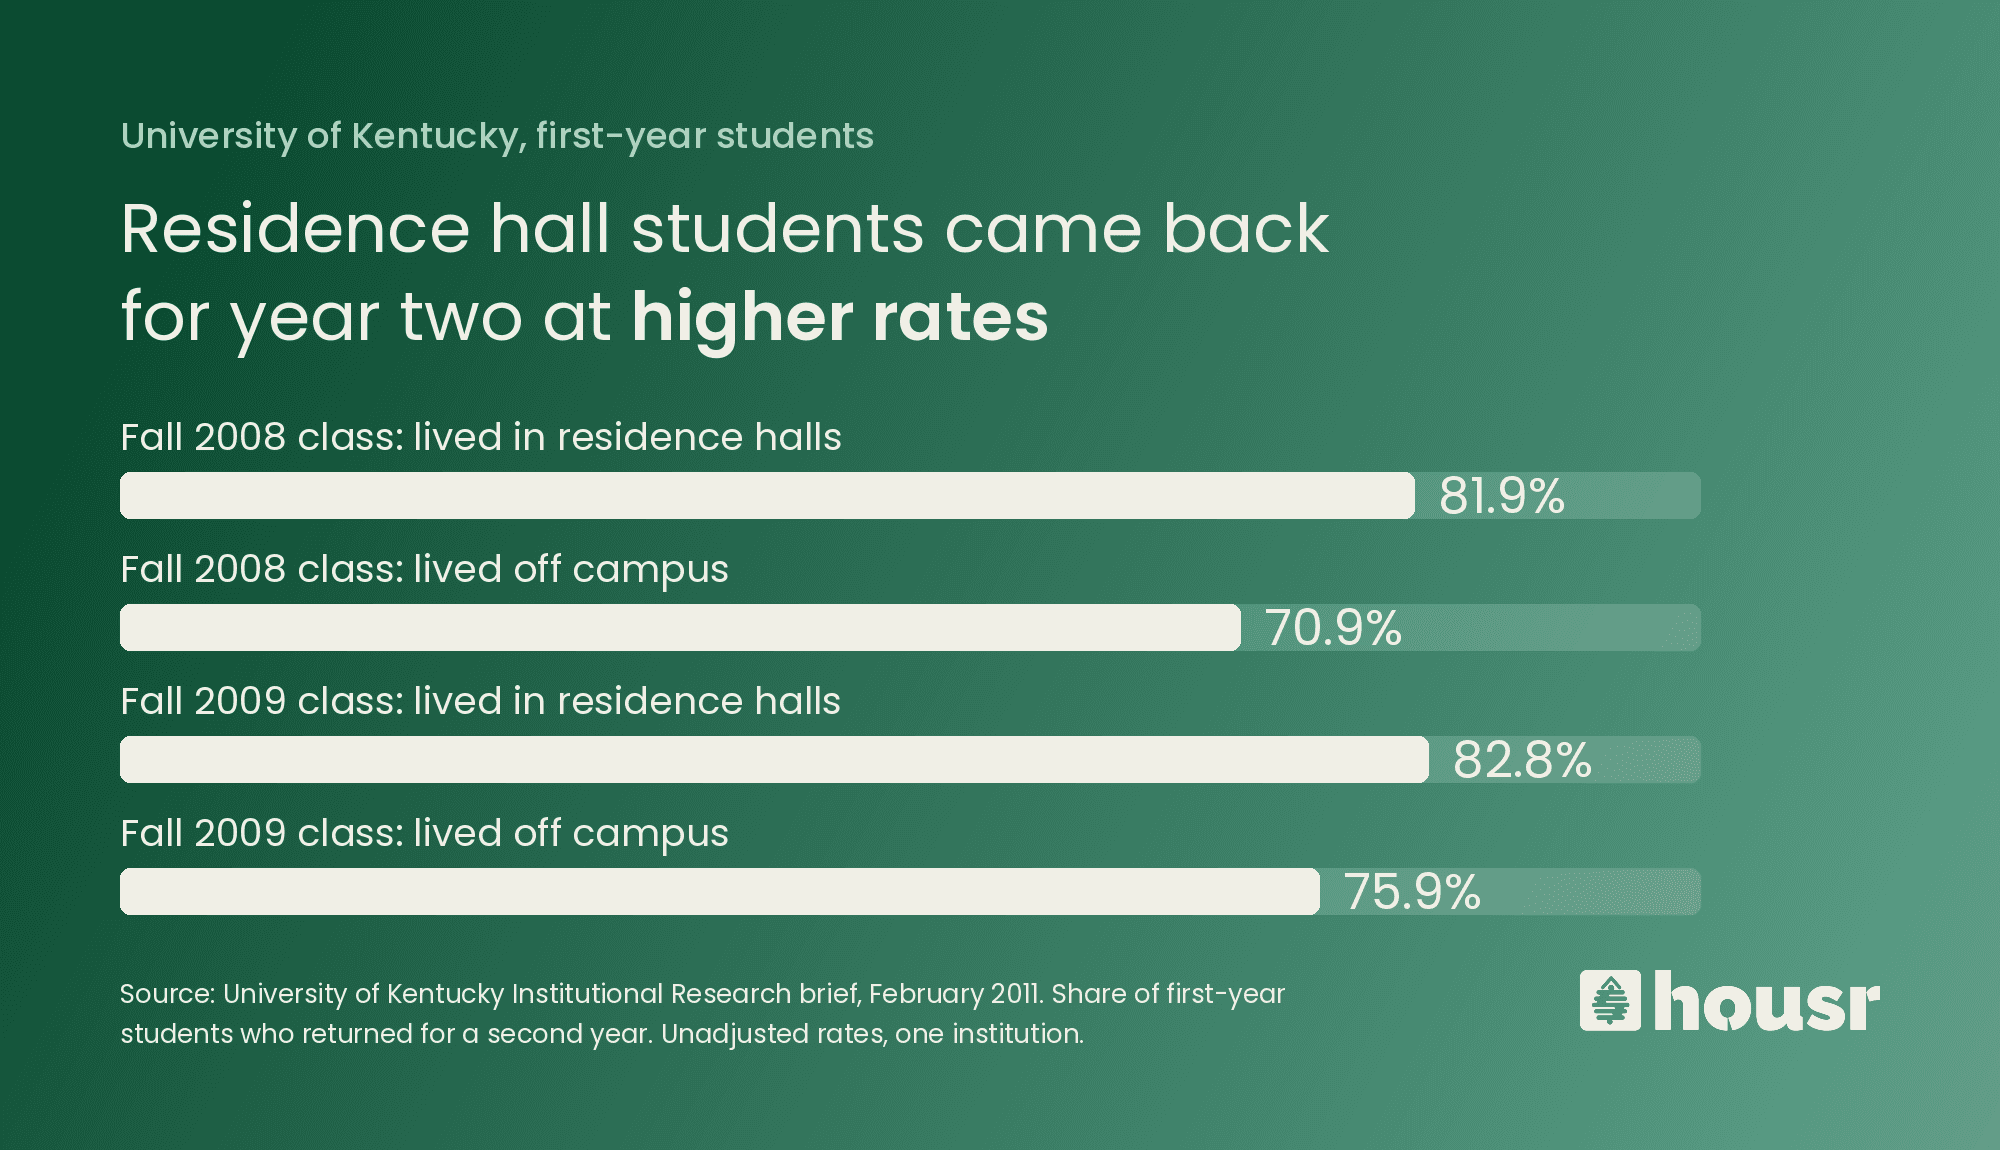
Source: University of Kentucky Institutional Research, February 2011. Fall 2008: 3,495 residence hall students and 584 off-campus students. Fall 2009: 3,478 and 635. Rates are unadjusted and come from one institution.
Nobody had hidden that gap. Off-campus students were about one in seven first-years at Kentucky, so an 11-point difference barely moved the class-wide rate, which works out to roughly 80% for the fall 2008 class.
At Kentucky the off-campus group was small enough to disappear into the average. Nationally it runs the other way. Only about 1 in 6 US undergraduates lives in campus housing, so at many schools the campus-wide rate mostly describes off-campus students without ever saying so. Either way, one number can't tell you how each group is doing. And if you're trying to improve belonging for off-campus students, you need a way to tell whether anything you try is working.
You probably don't need new software or a new survey to run the same split. Most of the data already exists in housing, the registrar's office and institutional research. This guide walks through how to pull it together in seven steps, in a way your IR team will recognize and your leadership can act on.
Before you start: who to bring in
This is a small project, but it touches several offices, so line them up first.
Institutional research. They already calculate retention, and they know how your census dates and cohorts are defined. Ask them to own the numbers so everyone trusts them.
Housing and residence life. They hold the on-campus assignment records, which is the most reliable piece of living-situation data you have.
The registrar. Local and permanent addresses usually live in the student information system.
Student affairs or commuter services. They're the people who will use the results, so they should help decide what questions to ask.
On privacy: FERPA lets school officials with a legitimate educational interest use student records for work like this. Keep the analysis inside the institution, share results as group totals rather than individual names, and hide any group too small to report safely. A common rule is not to publish any group with fewer than 10 students.
Step 1: Decide which living situations you'll compare
Keep the categories simple enough that you can fill them from data you have. We suggest four:
On campus
Off campus, within walking distance
Off campus, farther away (driving or transit)
Living with parents or family
These line up with how national research groups students. The study of 17,000 students at 44 colleges we cite in our belonging post used the same walking-versus-driving split, and it found real differences between those groups. Add a fifth category, "unknown," for students you can't place. Don't guess. If "unknown" is a big group, that's a finding in itself.
Step 2: Find the living-situation data you already have
Work through your sources from most reliable to least.
Housing assignment records. Anyone with an active room assignment on your census date is on campus. Housing can usually export this as a list of student IDs in a few minutes.
Local and permanent addresses. For everyone else, pull the local address and the permanent (home) address from the student information system. If the two match, or the local address is blank and the home address is nearby, the student most likely lives with family. If they differ, the student most likely rents off campus.
Distance to campus. Convert each local address to a distance from campus. Your IR or GIS team can do this in bulk, or you can start with ZIP codes. Pick a cutoff for walking distance that fits your campus, such as one mile, and write it down so you use the same one every term.
Off-campus housing data. If you use an off-campus housing platform, it can fill gaps the address fields miss. The Housr University Portal, for example, shows housing teams which students have secured off-campus housing and which are still searching.
Addresses go stale, especially for students who move mid-year. Use the address on file as of your census date, and flag that limitation when you share results.
Step 3: Build one snapshot per term
Create a simple table with one row per student for each term. At minimum, include:
Student ID
Living-situation category (from Step 2)
Class year, and whether the student is new or transfer
Full-time or part-time status
Pell eligibility and first-generation status, if IR already tracks them
Take the snapshot on the same date every term, usually your official census date. That way you're comparing like with like from one year to the next.
Step 4: Connect it to the outcomes you already report
Now join your snapshot to the measures IR already calculates. Start with the ones leadership watches:
Fall-to-spring persistence
Fall-to-fall retention
Credits earned compared with credits attempted
Term GPA
If you have engagement data, add it too. Event check-ins, student organization rosters, rec center visits and advising appointments all work, as long as they can be matched to a student ID. These are often the earliest warning signs, because a student usually stops showing up long before they stop enrolling.
Step 5: Compare students who are actually comparable
People skip this step all the time, and it's how you end up with a chart that says the wrong thing. Off-campus students tend to be older. More of them go part-time, and more of them hold jobs. Line up every off-campus student against every resident and you might just be measuring age and work hours, with housing barely in the picture.
So compare within groups. Look at full-time, first-year students first, split by living situation. Then repeat for transfers and for upper-class students. If off-campus first-years retain at a noticeably lower rate than on-campus first-years with similar profiles, you've found something worth acting on.
The University of New Mexico's 2016 review of a freshman residence requirement shows what's at stake. For the class that entered in 2009, 52.4% of students who lived on campus as freshmen graduated within six years, against 45.6% of those who lived off campus. Among Pell-eligible students the gap shrank to about one point, 40.6% against 39.5%. A lot of the headline difference came down to which students lived on campus in the first place.
Step 6: Add a belonging measure
Retention numbers arrive late, after the student is already gone. Belonging data can show you the drift while there's still time to do something. Kentucky's brief picked it up: 80.3% of residence hall first-years rated themselves successful at building a network of friends, against 60.9% of off-campus first-years.
If your campus runs the National Survey of Student Engagement, it already asks three belonging questions. Students rate how strongly they agree that they feel comfortable being themselves at the institution, feel valued by it, and feel part of its community. NSSE's belonging toolkit explains how to work with the results.
If you don't use NSSE, add those three statements to a survey you already send, along with one question about where the student lives. A short check-in in week six of the fall term is a good place for it. Response rates from off-campus students are often lower, so promote the survey through channels they actually see, like class announcements and texts, not just residence hall flyers.
Step 7: Share it, and repeat every term
Keep the output to one page. A simple table like the one below is enough for a cabinet meeting.
Living situation | Students (fall census) | Fall-to-spring persistence | Fall-to-fall retention | Agree "I feel part of the community" |
|---|---|---|---|---|
On campus | ||||
Off campus, walking distance | ||||
Off campus, farther away | ||||
With parents or family | ||||
Unknown |
Under the table, write two or three sentences about what changed since last term and what your team plans to do about it. Then pick one owner, usually someone in IR or student affairs assessment, and put the next refresh on the calendar for the following census date.
The first version won't be perfect. Addresses will be messy and some students will land in "unknown." That's fine. A rough split you repeat every term is far more useful than a perfect one you run once.
What to do with what you find
If off-campus students are retaining at the same rate as residential students, great. Keep measuring so you'll notice if that changes.
If they're behind, you now have a baseline and a way to track progress. Our post on how to improve sense of belonging for off-campus students covers programs other schools run and a short audit to help you decide where to start.
See where your off-campus students are
The hardest part of this work is usually knowing where off-campus students are living and how their housing search is going. Housr gives housing and student affairs teams verified off-campus housing and a real-time view of where students are in their search, without the school owning any housing. If that visibility is the missing piece at your school, talk to our team about the Housr University Portal.
Download the Housr app
The Housr app helps you manage everything in one place. Search for your next house with friends, arrange property viewings and chat to landlords directly.
We also send exclusive promotions and events to our student community via the Housr app, giving you plenty of opportunity to get freebies and save cash at uni.


